
Rendered.ai recently announced a remote-sensing synthetic data channel based on the Digital Imaging and Remote Sensing Image Generation (DIRSIG™) model. DIRSIG is a physics-based multispectral/hyperspectral data generation tool maintained by the Rochester Institute of Technology.
To accompany this announcement, Rendered.ai is offering a content-rich demonstration workspace, complete with a series of job configuration graphs and their accompanying datasets.
While the demonstration workspace will show you how to use DIRSIG within Rendered.ai, the channel associated with it does not provide the actual simulation libraries. Users will need to be granted access to the DIRSIG software for a fully functioning channel.
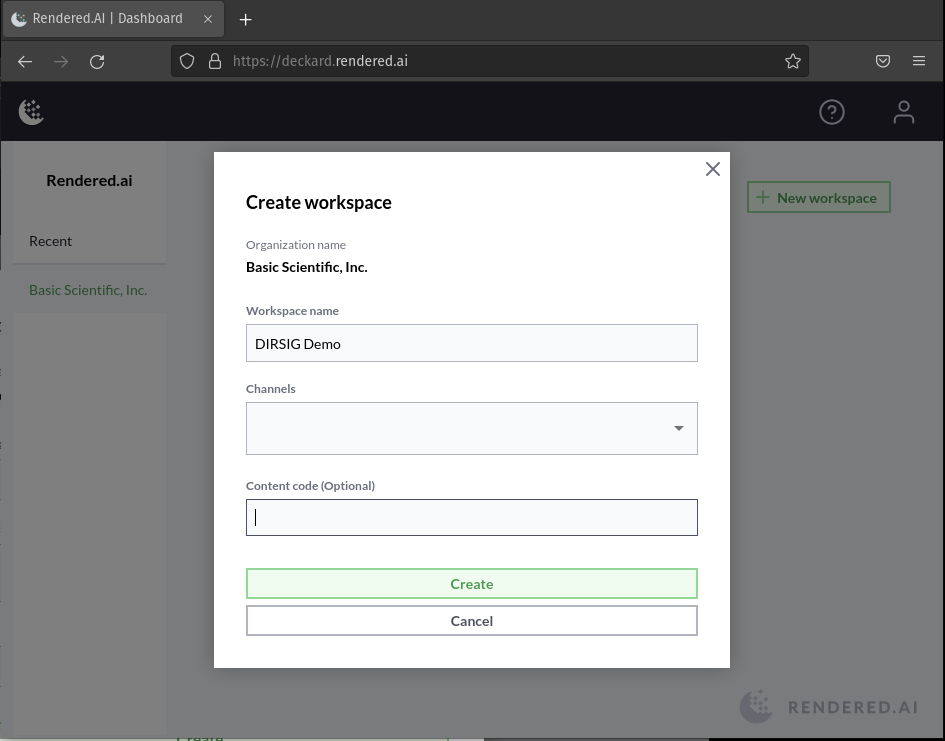
To help users understand how to use Rendered.ai channels, we’ve created content codes that provide access to trial content. When creating a new workspace, or project, entering a content code will load the workspace with several graphs and datasets. To see what you can do with the DIRSIG Remote Sensing Channel, use the content code ‘DIRSIGDEMO’
From the main workspace view, your graphs, jobs, recent dataset, and workspace limits are shown.

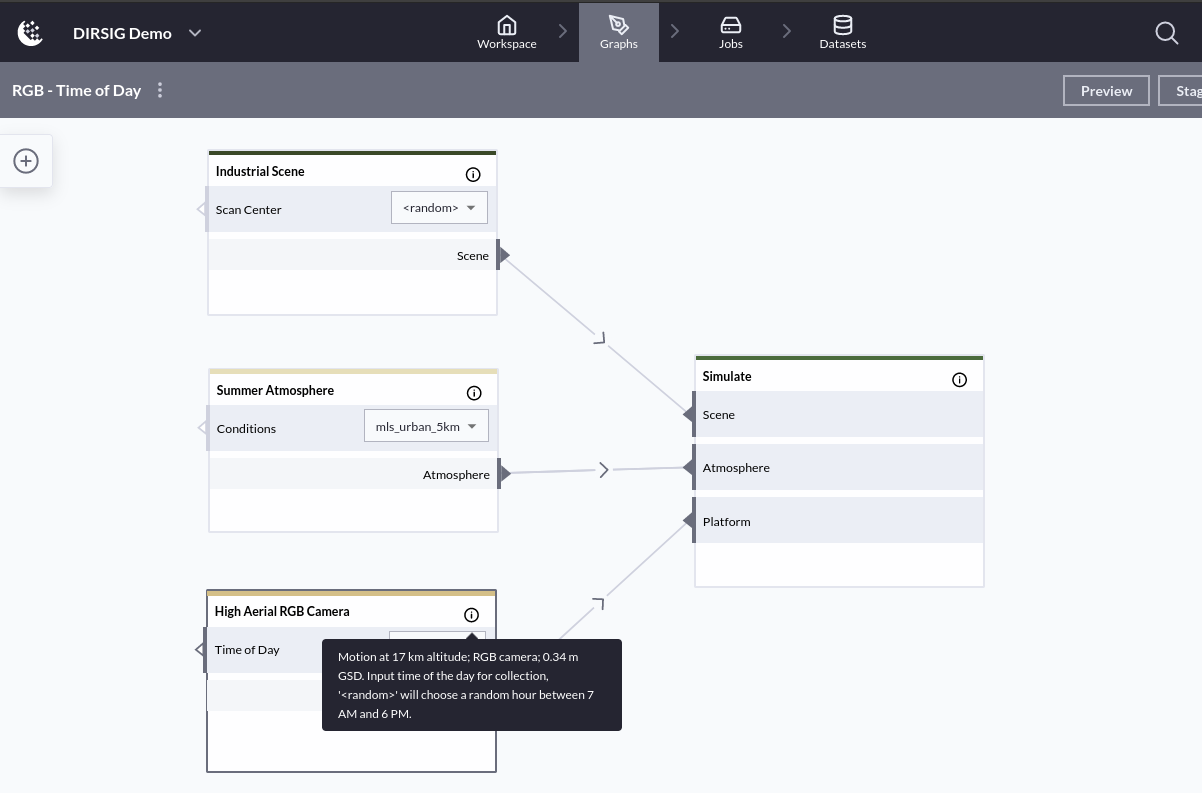
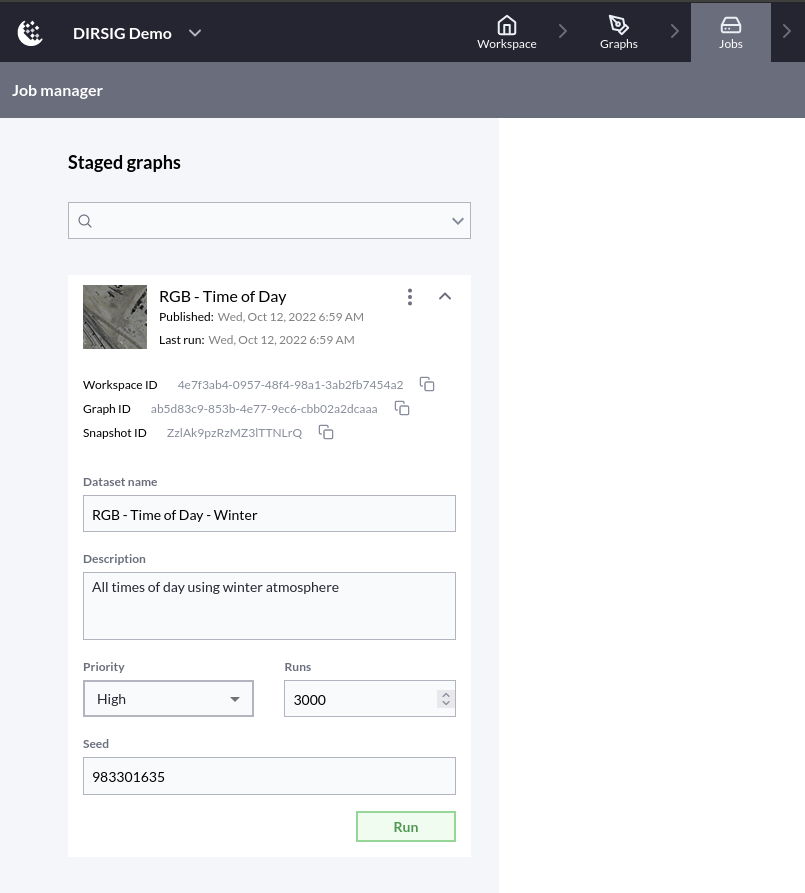
Various graphs come with the trial content, each graph has two parts to the name: the first part references the sensor the graph is based on, while the second part references the primary parameter the graph is meant to randomize. For example, the ‘RGB — Time of Day’ graph uses the High Aerial RGB Camera platform and generates images with a random hour between 7 AM and 6 PM.
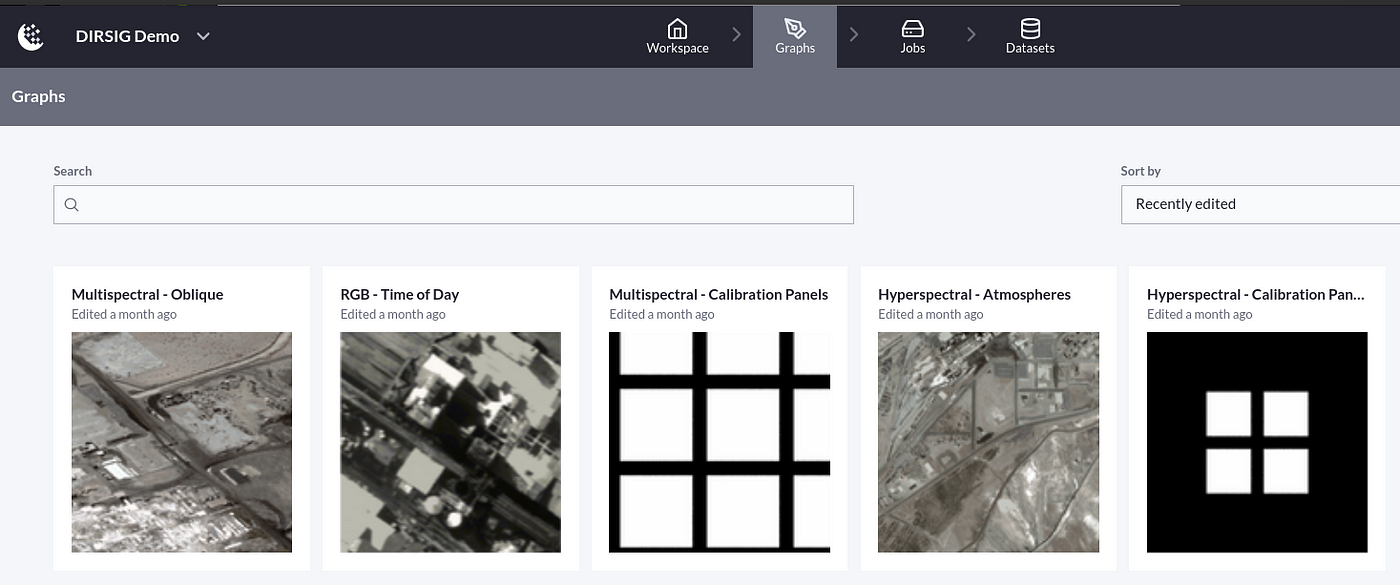
The DIRSIG demonstration graphs can be accessed from the Workspace tab or from the Graphs tab. There are two graphs that randomize the calibration panels scene, and one each that randomizes the atmospheric conditions, time of day, and oblique views of a location. The inputs for each field are described in the node tooltip.
There are three types of nodes in the Rendered.ai DIRSIG Remote Sensing Channel: scenes, atmospheres, and platforms. The exposed randomization parameter for each node is given here:
Scenes
- Calibration Panels: panel size, spacing, and offset
- Industrial: image center
Atmospheres
- Winter (mid-latitude, 30km): latitude, aerosols, visibility
- Summer (mid-latitude, 50km): aerosols, visibility
Platforms
- Satellite HSI: time of day
- High Aerial RGB: time of day
- Low Aerial MSI: time of day, look angle, platform azimuth
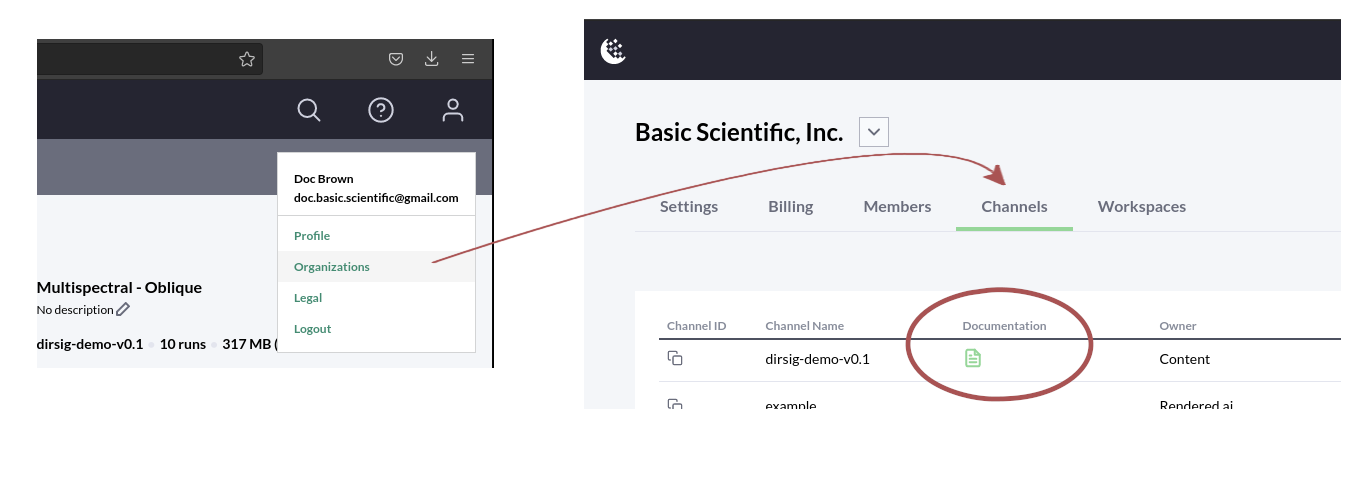
Descriptions of all the available nodes are given in the channel documentation (under the Channels tab in your user Organizations view).
Typically, a graph can be modified to generate data with different properties. For example, a user might have created the ‘RGB — Time of Day’ graph, run a job for a few thousand images, and found that their use case would benefit from more data at dawn/dusk or with different atmospheric conditions. The user could then make adjustments to the graph and stage it for a new job.
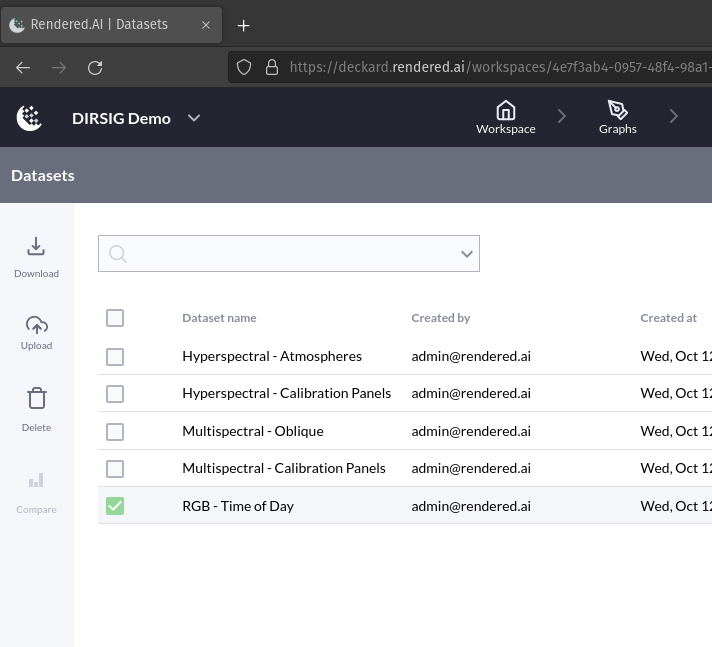
As mentioned at the top, the channel for the demonstration workspace is not equipped with the actual DIRSIG simulation software, but each of the provided graphs has been run offline and is available in the datasets library under the datasets tab. To see the contents of a dataset, select it and click the download button.
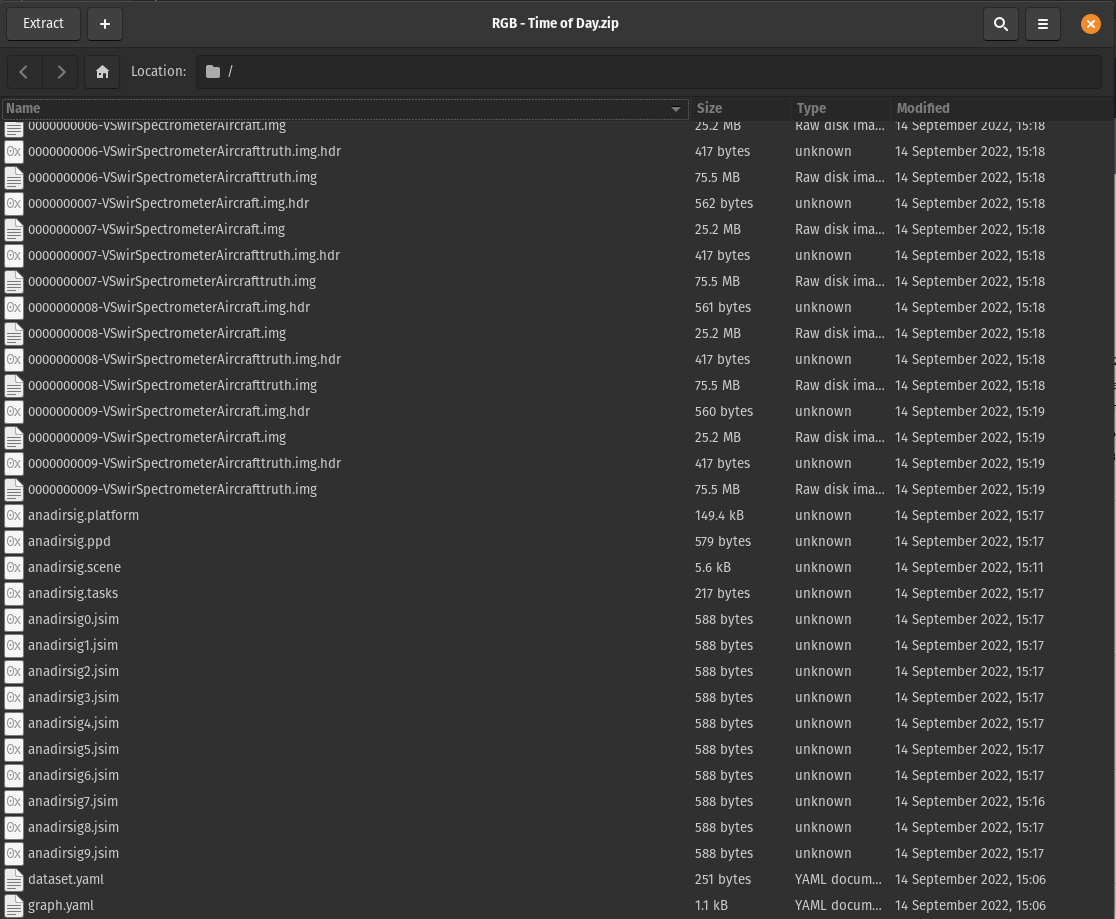
A downloaded dataset contains
- ENVI datacubes and pixel-level truth data
- Dataset metadata and graph configuration file
- DIRSIG simulation configuration files
ENVI files can be opened with several tools, such as MATLAB, the Python spectral package (SPy), or other free software like QGIS. For example, the spectral plots can be viewed for any pixel in int datacube.

Interested in getting started with a fully functioning DIRSIG-based channel? Check us out on the AWS Marketplace or contact us!
If you’d like to learn more here are some additional resources:
- Video overview of the DIRSIG Remote Sensing Channel
- Press release
- Geospatial world article on our collaboration with RIT
- DIRS Lab website
- Support documentation and learning path

