TL;DR; Our partnership with the RIT DIRS Laboratory enables us to use the physically accurate DIRSIG(TM) simulator in Rendered.ai for synthetic data generation. We have added updates for trial users to explore common sensor and platform configurations with standard scenes that are provided through DIRSIG. With new content available, we hope that more remote sensing teams who are training and testing AI/ML systems can benefit from Rendered.ai’s ability to host massively scalable, fully labeled training dataset creation in the cloud.

Simulated remote sensing imagery from DIRSIG with Rendered.ai
Expanding DIRSIG trial capability in Rendered.ai
At Rendered.ai, we continue to add demonstration and evaluation content available for users who want to explore different types of synthetic imagery. The Rendered.ai platform as a service (PaaS) allows customers to generate massive fully labeled datasets, without having to manage cloud infrastructure themselves. We recently added a new channel for creating synthetic data with DIRSIG, the physically accurate simulator from the Rochester Institute of Technology. The DIRSIG Channel, our term for a synthetic data application that runs in Rendered.ai, is available for production use. With the DIRSIG Channel, users are able to design and configure simulations for generating multispectral and hyperspectral Earth observation imagery and drone-based oblique imagery.
Sign up for a trial and use the content code DIRSIGv2!
Late last year, I shared examples of datasets that became possible as a result of the Rendered.ai and RIT’s DIRS Laboratory partnership in the blog, What you can do with the Rendered.ai DIRSIG Remote Sensing Channel. Since then, I have worked with Dr. Scott Brown, Leader of the Modeling and Simulation group at RIT, to incorporate common sensors and scenes asked for by DIRSIG users. The result is a new synthetic data channel with several prebuilt configurations, called graphs in Rendered.ai, that may be accessed through our 30-day trial evaluation.
This sample content can be accessed simply by signing up with Rendered.ai and creating a workspace with the content code: DIRSIGv2.
You can see some of the new content at work in a webinar that I recently presented with with Dr. Brown and Dan Hedges, Lead Solution Architect at Rendered.ai: Synthetic Computer Vision Data with DIRSIG for AI Training.
There are several benefits of hosting DIRSIG on the Rendered.ai platform.
· Running DIRSIG to generate large datasets or simulations of full collections requires significant cloud resources. Rendered.ai abstracts away infrastructure management tasks such as scaling disk, memory, or queueing simultaneous runs.
· Rendered.ai’s graphs enable users to configure and reuse common simulation configurations. Computer Vision (CV) engineers and data scientists can use the web interface to create multiple configurations of graphs to easily create datasets to drive algorithm training and validation.
· Rendered.ai enables team-based collaboration and, for DIRSIG, this is particularly helpful as users typically are required to go through RIT training to use DIRSIG. With Rendered.ai, teams can collaborate on channels so that sensor-focused team members could configure a simulation and then data scientists can create as many variations on datasets as they want.
DIRSIG’s features and suite of tools are highly modular so the interfaces can be directly exposed in the Rendered.ai user interface through nodes in graphs, connecting DIRSIG’s thorough user documentation to the displayed fields in a Rendered.ai graph.
Sensors and Scenes
In the Rendered.ai DIRSIG Channel, the nodes used to describe DIRSIG platform configurations are simplified framing–array approximations. As a result, each node has representative GSDs for the named sensors, but arbitrary chip size. We have included approximations to a few well-known Earth observation systems chosen to give a variety of resolutions, from ~3m GSD to ~75 cm GSD. The HSI spectrometer is configured for two altitudes to produce data as if flown by commonly deployed vessels, a Twin Otter and a U-2 aircraft. The drone altitude can be entered manually and has an GSD at nadir of 50 cm when flown at 60 meters above the surface. Also, the look angle for the camera on the drone is exposed so various levels of oblique imagery can be captured.
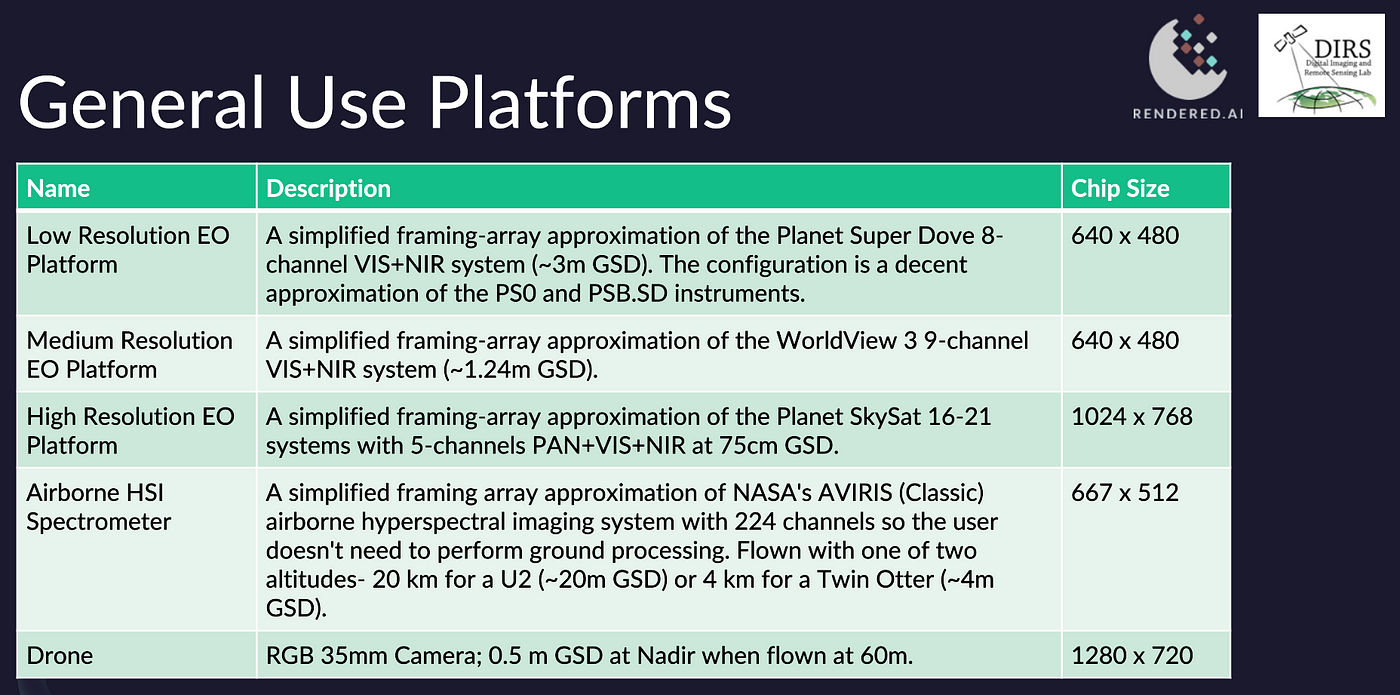
Common sensor and vehicle platforms
There are several scenes available for use in the workspace created by using the DIRSIGv2 content code. Anyone who has gone through the DIRSIG training will recognize the suburb of MegaScene1 and the industrial plant of MegaScene2. The scenes are modeled at different levels of detail, so while the “MegaScenes” are rich in 3D content, and used for high resolution imagery, the scenes based on Lake Tahoe and Denver are intended to be used with low resolution HSI spectrometers or ~3m resolution sensors.
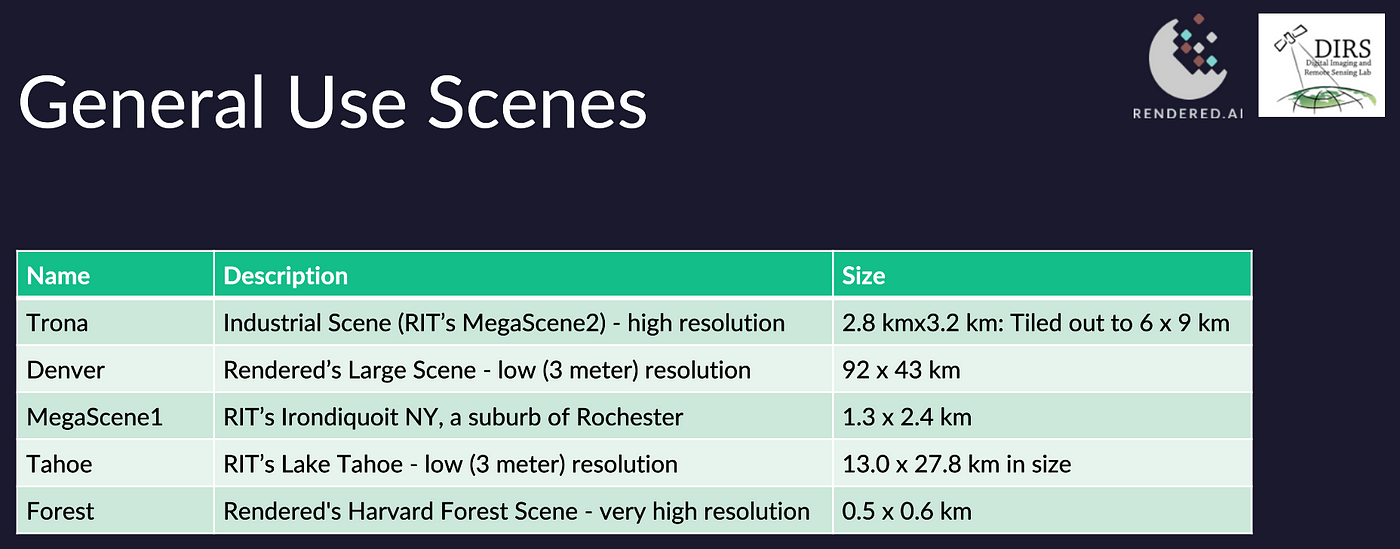
Scenes available for use with the DIRSIGv2 content code workspace
To demonstrate how the sensors and scenes work together for dataset generation, several graphs, or channel configurations, are provided in the workspace available with the content code. Each graph is named based on the sensor and the scene, and in each of these there are randomized parameters and truth collectors.
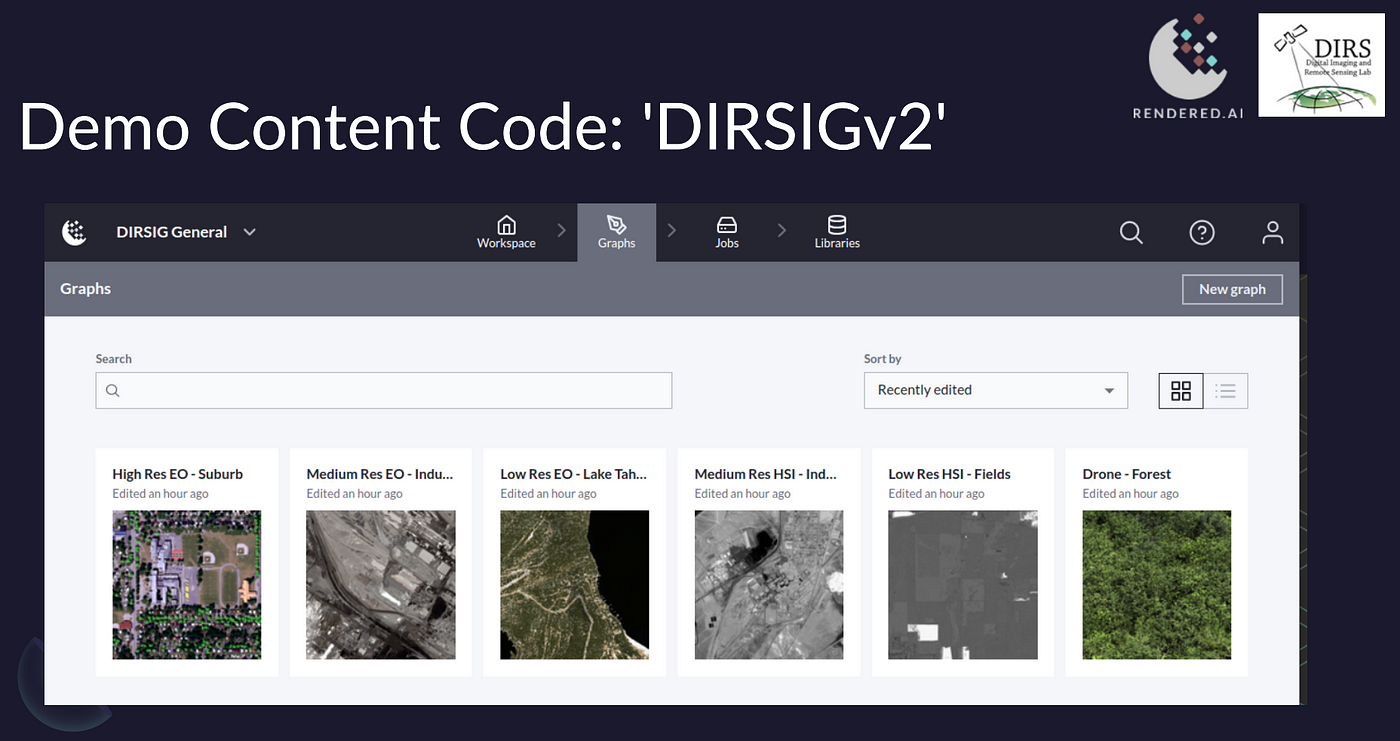
Graphs in the DIRSIG General Workspace
The content code workspace has a dataset for each graph ready to download, and the user can modify the graphs and kick off a job for additional batches of runs. In the screenshot below, the Datasets library is shown where users can inspect metadata, download datasets, generate analytics, and compare datasets.
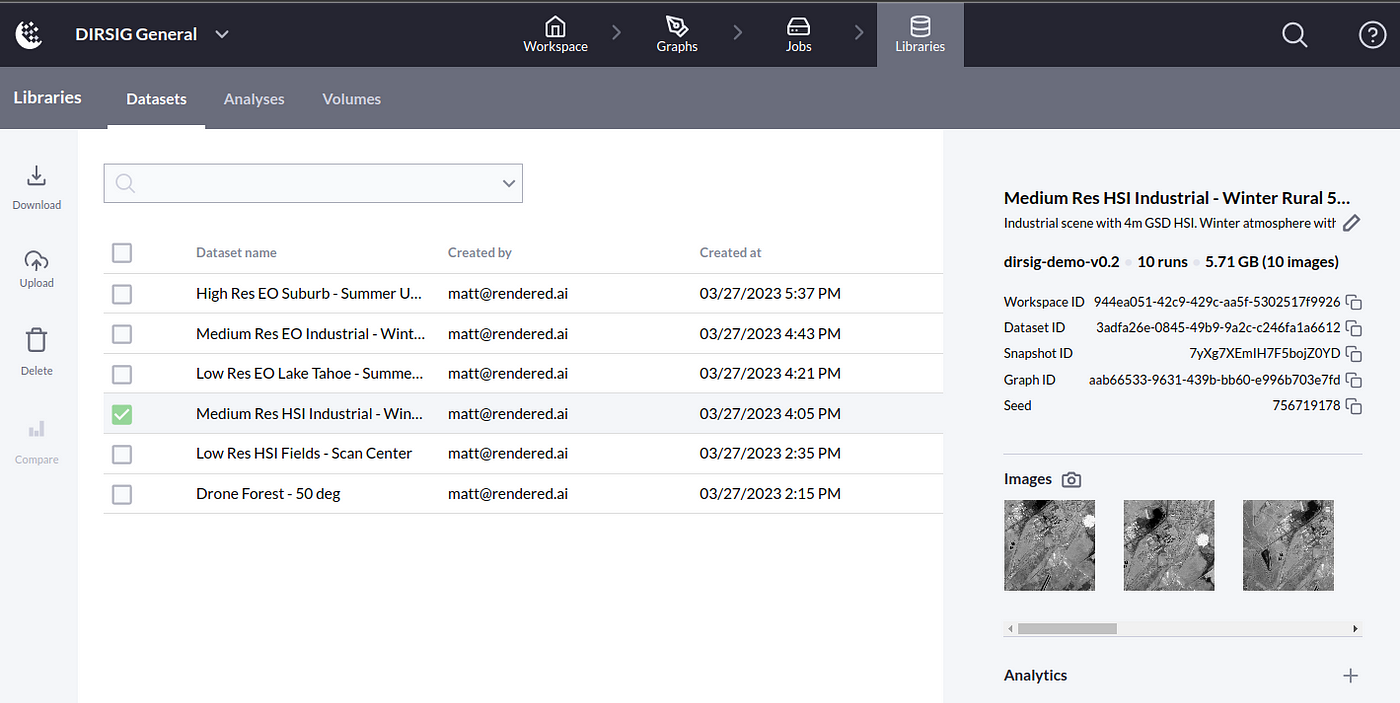
Datasets in the DIRSIG General Workspace
Earth Observation Imagery
The “High Res EO — Suburb” and “Medium Res EO — Industrial” graphs demonstrate randomization options of the scan center, and atmospheric conditions.
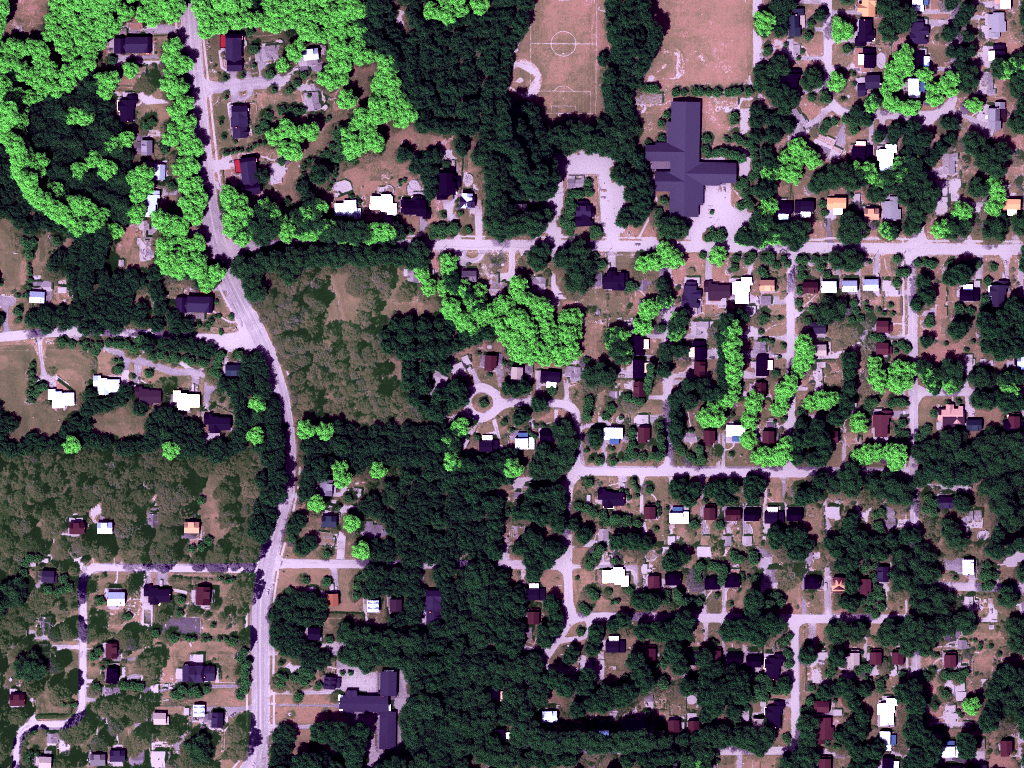
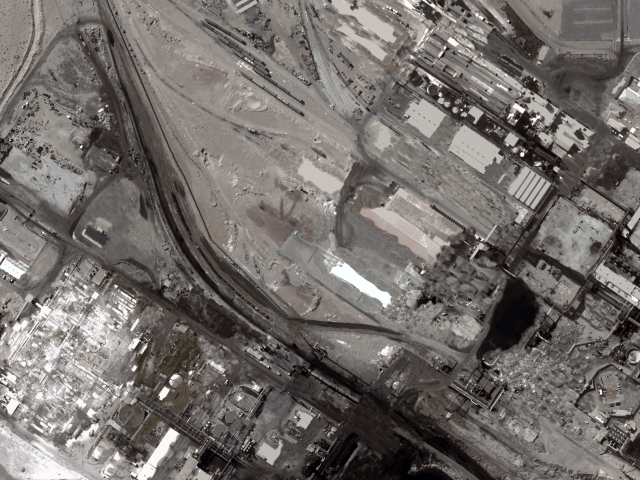
MegaScene1-SkySat (Left) and MegaScene2-WorldView3 (Right) Sensor Approximation Examples
The suburb of MegaScene1 is simulated with a randomly chosen scene center for a specific atmospheric condition, while the industrial scene is simulated with a fixed scene center and random atmospheric conditions.
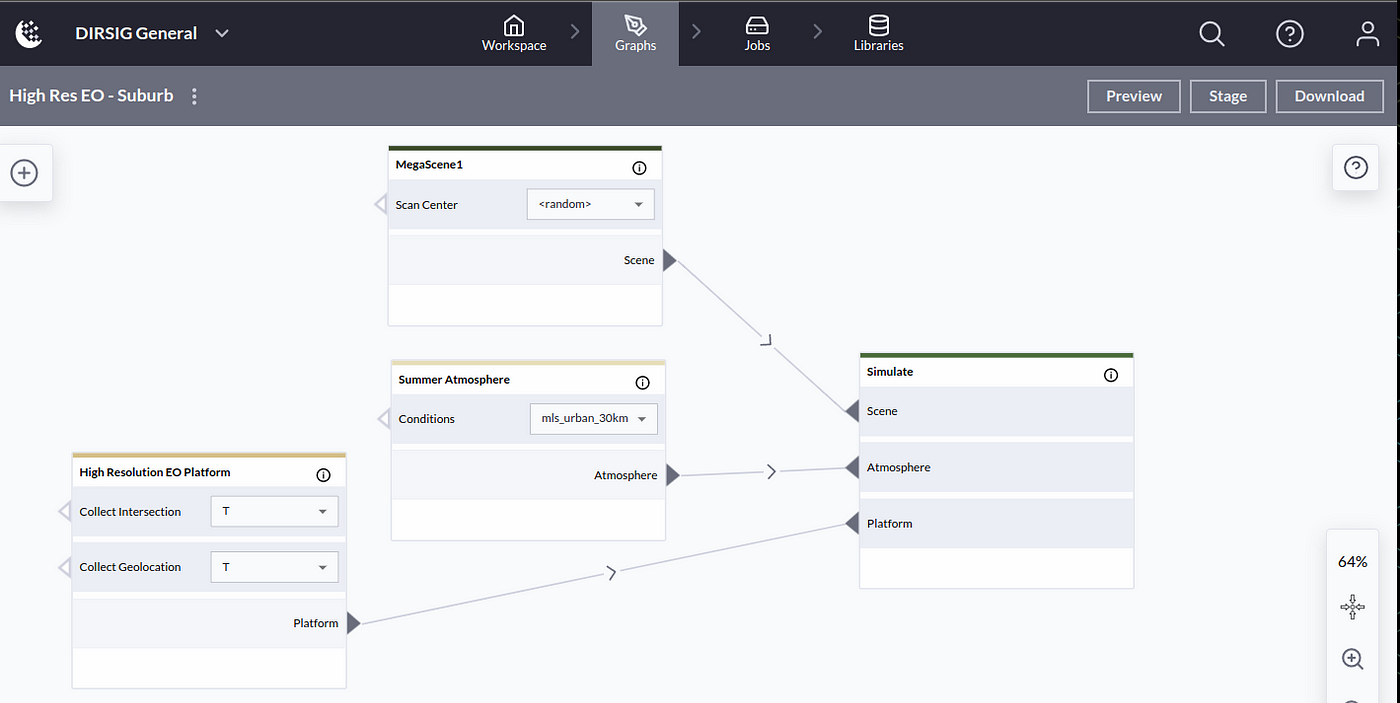
High Resolution EO Sensor with MegaScene1 — Scan Center Randomized
These sensors can collect truth for the “Intersection” (DIRSIG Doc) and “Geolocation” (DIRSIG Doc) while randomizing the scan center. The documentation on the truth collectors describes how to interpret the raster truth images.
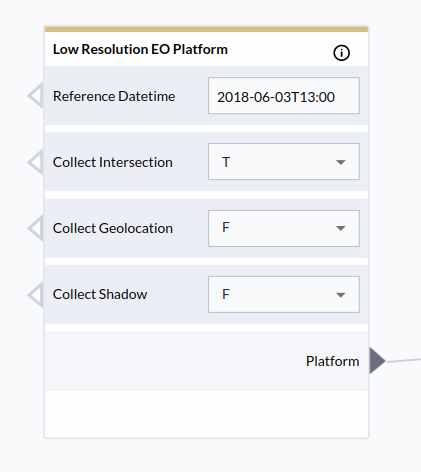
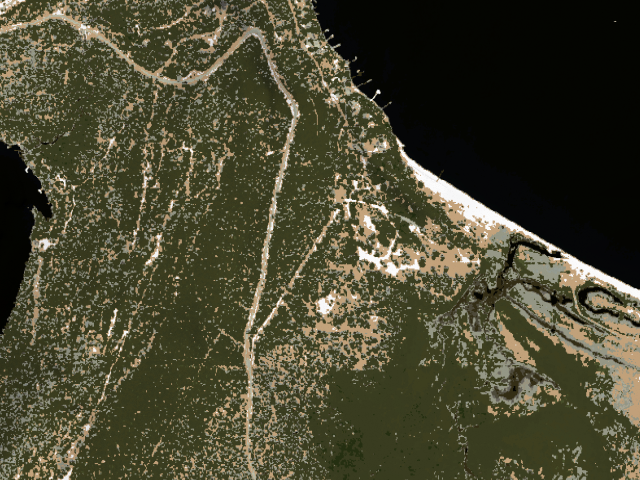
Lake Tahoe Scene — SuperDove Sensor Approximation Example
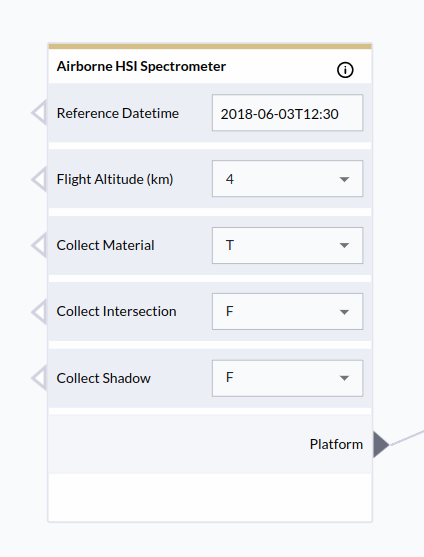
The two graphs named “Medium Res HSI — Industrial” and “Low Res HSI — Fields” have a platform node, “Airborne HSI Spectrometer” that configures DIRSIG for hyperspectral simulations. These two graphs achieve different resolutions with the same platform node at different flight altitudes as described above. Many users interested in HSI data want to collect truth for the materials represented in the pixels. As shown in the “Airborne HSI Spectrometer” below, DIRSIG can collect information about what materials (DIRSIG Doc) are present within each pixel as well as sub-pixel abundance fractions (DIRSIG Doc).
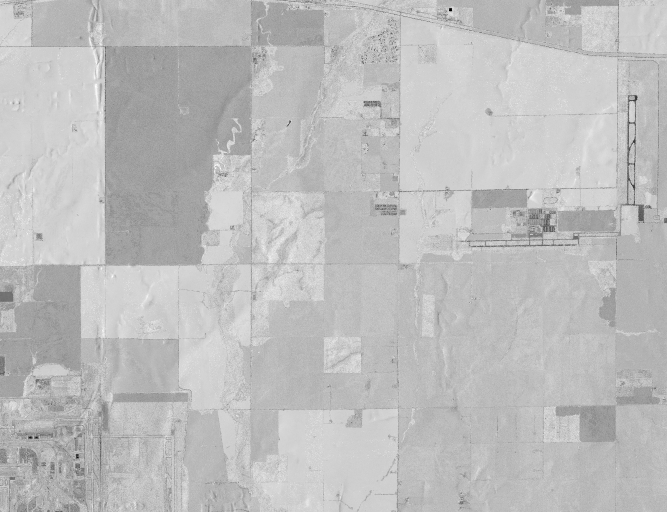
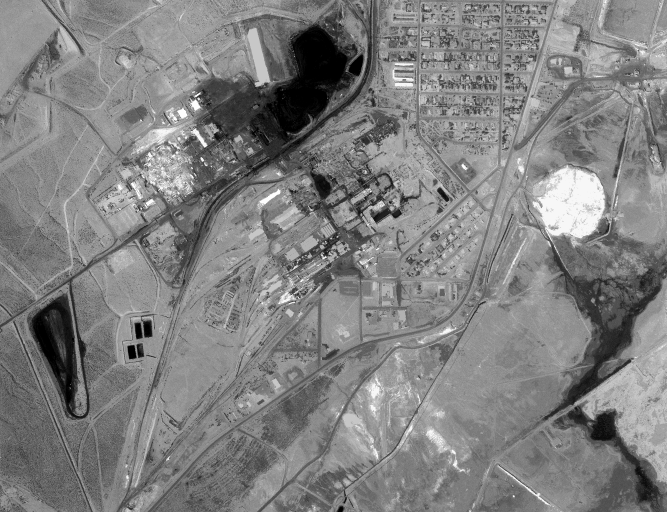
Examples of Two Resolutions of the AVIRIS HSI Approximation using the Denver Cropland and Industrial (MegaScene2) Scenes
In the “Drone — Forest” graph, a 35 mm camera is flown at very low altitudes. The Drone platform node supports look angles up to 50 degrees for oblique imagery. The Drone flight altitude is parameterized, as well as the direction it is heading. The Platform Azimuth can be selected, where ‘<random>’ is any angle. In the following graph, one of Rendered.ai common random number generator nodes is used to randomize the flight altitude in a user-specified manner.

Rendered.ai Graph with the Drone Platform Node of the DIRSIG General Channel
Get in touch to have a chat or request a demo of Rendered.ai!
To find out more about DIRSIG, visit the RIT DIRS Laboratory site.


